Debugging charm hooks
Not everything works the first time, and sometimes even when it seems to work, things don't happen quite as you expected. Juju provides commands to help developers debug charm code, and there are also community written plugins that can help with the debugging process.
Juju provides two commands, juju debug-log and
juju debug-hooks, to help developers resolve
problems in their code. The dhx debugging plugin
improves the debug-hooks experience by performing some common actions
automatically. Or maybe you're having an issue with building from your charm
layer, in which case the debugging with layers
is where to look.
The 'debug-log' command
Logs are indispensable when it comes time to troubleshoot. View the log with
the juju debug-log command. The output is a consolidation of all the Juju log
files streaming in real time. The logs show you detailed inner workings of Juju
and any juju-log messages that are
run from the charm code.
See the troubleshooting
logs section for more
details and filtering options
with the juju debug-log command.
Log file location
Since log messages stream in real time, it is possible to miss messages while
using the debug-log command. In the case where you need to view the log files
you can ssh to the machine and view the log files. To access the individual
machine use juju ssh <machine-number> to get access to the machine and the
Juju log files can be found in the /var/log/juju directory.
Fore more information about what you can do with the log files please refer to viewing logs.
Log files on the controller
Beginning with Juju 2.0, the machine running the controller is not represented in the Juju model and therefore not accessible by machine number. If you need the log files from the controller you must switch to the "admin" model and ssh to machine 0.
juju switch local.amazon:admin
juju ssh 0
Replace "local.amazon" with your current controller or just use "admin" to switch to the admin model for the default controller.
The 'debug-hooks' command
It's often useful to be able to test code in the same context that a hook
executes in. The juju debug-hooks command allows you to do exactly that,
whether it's to debug a failed hook or to write and test new hook code.
juju debug-hooks accepts a unit and an optional list of hooks to debug (which must be named individually
in a space-delimited list) or no hook names, causing all hooks to be debugged:
juju debug-hooks <application/unit> [hook-name hook-name2 ...]
So for example, imagine you are deploying the mysql charm and you want to only
check the db-relation-joined and db-relation-broken hooks:
juju debug-hooks mysql/0 db-relation-joined db-relation-broken
Additionally, if your hook is already in an error state, you can enter into an
interactive hook context using the juju debug-hooks command. The session is
interactive because Juju will block allowing you to run the hooks manually to
check the return code or edit hook files before running the next hook. To
reach the hook context Juju must retry the failed hook. You can retry a hook in
error by issuing the juju resolved command. See the Retrying failed
hooks section for more information about how to retry
hooks.
Note: It is possible and often desirable to run debug-hooks on more than one unit at a time. You should open a new terminal window for each.
To debug actions, you use the same command, like this:
juju debug-hooks <service/unit> [action-name action-name2 ...]
For example, if you want to check the add-repo action of a the git charm,
use:
juju debug-hooks git/0 add-repo
Learn more about actions in Juju actions.
Running a debug session
When you run the debug-hooks command, Juju creates a slightly customised tmux
session on the machine running the requested unit (if you are unfamiliar with
tmux, see the primer at the end of this section).
The tmux session will start with window 0. This window does nothing other than
keep the session alive (though it can be used, for example, to view the log
files for that unit (in /var/log/juju/).
When the first hook event is queued for a hook that is in the list of those to be debugged:
- A new window will be attached to the tmux session.
- The bottom left of the status bar will change to indicate the current hook that has been trapped.
- The prompt will change to indicate the hook related to the window (e.g.
mysql/0:db-relation-joined %) - The shell will be running in the standard hook context.
- Additionally, the environment variable
$JUJU_HOOK_NAMEis set appropriately.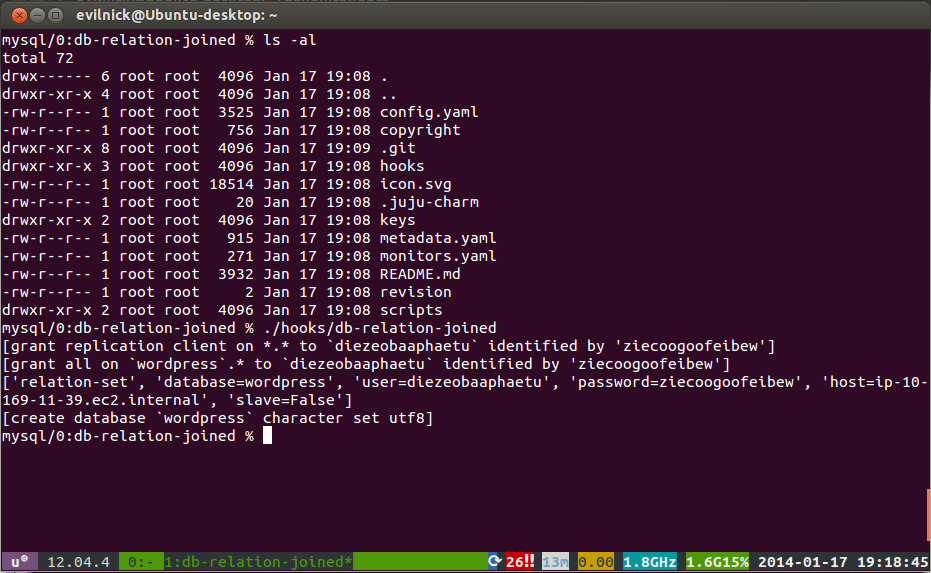
To proceed, you should manually execute the hook, or perform whatever other actions you want. At any time during a debug-hooks window 1 session you can run any of the standard hooks (install, start, stop, config-changed, upgrade-charm) however you can not run any of the relation hooks - these should only be run during their respective trapped events.
For example, for the db-relation-joined hook we mentioned above, you could
run:
./hooks/db-relation-joined
Whilst you are debugging a hook, it is possible that other hooks will be queued to run. Even hooks which are not in your list to debug will be suspended in the queue until you exit your current window. See the special considerations below.
The queue for pending hooks will restart once you exit the window with an exit
command.
Note: To allow Juju to continue processing events normally, you must exit the hook execution window with the exit command, otherwise all further events on that unit will be paused indefinitely.
The queue can be halted by exiting with an exit 1 command, which will flag the
hook as failed. Juju will revert to its normal behaviour of suspending
everything until this error status is resolved, which you can do by issuing the
command (from your juju terminal window, not the debugging window) of
juju resolved <unit>.
You can finish your debugging session by closing all windows in the tmux session. Make sure to exit appropriately from all hook windows before terminating.
Retrying failed hooks
Hooks returning errors are automatically retried periodically. However, the
juju resolved command may still be used to retry the hook immediately. See
the General configuration options
for more information on the automatic retry feature and how to disable this
behaviour. Note that option --no-retry can be used to prevent re-execution of
failed hooks on the unit.
Debugging reactive Charms
Debugging a reactive Charm is similar to debugging a regular charm: you use juju debug-hooks to get into the hook context and you start the reactive framework by executing the hook file in the hooks/ directory. That hook will start the reactive framework and run your handlers based on which flags are set. Note that the reactive framework resets all flags to their original value when a handler crashes. Changes to flags happen immediately, but they are only persisted at the end of a complete and successful run of the reactive framework. All unpersisted changes are discarded when a hook crashes. This is the case because a Juju hook is transactional: all changes such as open ports are discarded when the hook fails.
Tip: If essential hooks such as install and config-changed are not in the hooks directory of your Charm, you forgot to include layer:basic in your layer.yaml file.
charms.reactive command
charms.reactive has a commandline tool that can help you debugging Charms. You can use it to view, set and clear flags in a debug-hooks session. Charms built with older versions of the reactive framework might require you to use state instead of flag.
Show flags
$ charms.reactive -p get_flags

{
 'etcd.installed': None,
 'etcd.leader.configured': None,
 'etcd.package.adjusted': None,
 'etcd.ssl.placed': None,
 'leadership.is_leader': None,
 }
Note that all flag changes are reset when a handler crashes so this command will only show you the initial values at the start of the hook.
Set flags
$ charms.reactive set_flag cache.cleared
Debugging early hooks
The install, config-changed, and start hooks often execute quite soon
after the unit comes up, making it difficult to start a debug-hooks session in
time to intercept them. If you're having difficulties, you can temporarily
return an error code from your install hook (e.g. add an exit 1 at the end
of it), and start your session only when the unit reports an error status
. Use a debug-hooks session to interact with the
environment and run the hook again.
Special considerations
While you're debugging hooks for one unit on a machine, you're blocking execution of all hooks on that machine. This is generally helpful, because you don't want to have to contend with concurrent changes to the machine's software, but you should be aware that multiple debug-hooks sessions for units assigned to the same machine will block one another, and that you can't control relative execution order directly (other than by erroring out of hooks you don't want to run yet, and retrying them later).
What on earth is tmux?
The Ubuntu images used by Juju also include a slightly customised version of
tmux, a terminal multiplexer.
It is very useful when debugging hooks, as new hook events can be opened as windows within tmux, meaning you don't need to deal with so many open windows, or (hopefully) get confused as to where to run commands.
This version runs through a layer called "byobu", which additionally adds some useful status information at the bottom of the screen.
Some useful definitions in the context of tmux:
Session
A running tmux environment, involving one or more windows/panes.
Window
A single screen, possibly containing many panes.
Pane
A rectangular section of the current window, where commands are entered.
A session may look something like this:
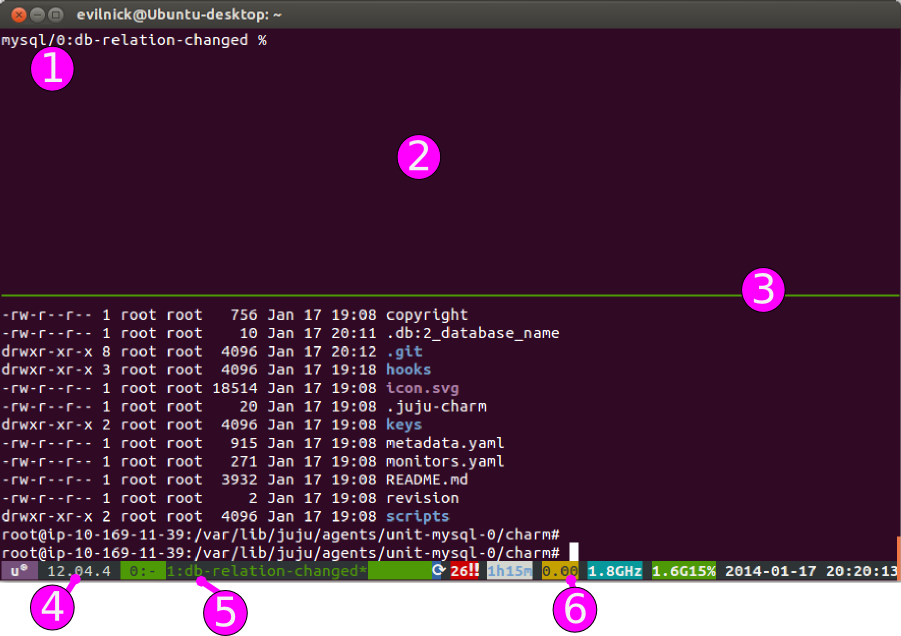
Key:
- The default prompt is changed to indicate the machine you are running on, and the hook that you are debugging.
- This is a tmux pane, after the screen has been split horizontally.
- Pane dividing line. The active pane is the one with the cursor in!
- The byobu display shows the OS and version info.
- This area lists the currently open windows, the current one is highlighted.
- The end part of the status bar indicates uptime, load, processor, memory usage and the current date/time.
Key bindings
All of tmux's special functions can be run by pressing the prefix-key followed
by another key or key combination. The default prefix-key for tmux is Control-b,
but many users find this an unnecessary stretch. This version uses Control-a as
the prefix key, which is a bit easier on the fingers and is also the same
combination used by screen, an alternative terminal multiplexer.
There are many key-combinations, not all of which are of use in the task at hand. Here are some of the ones you may find useful:
Window-related:
| Shortcut | Description |
|---|---|
| Control-a 0 | Switch to window 0 (similarly, any other numbered window). |
| Control-a c | Create a new window. |
| Control-a n | Switch to the next window. |
| Control-a p | Switch to the previous window. |
| Control-a w | Choose a window from a list. |
Pane-related:
| Shortcut | Description |
|---|---|
| Control-a % | Split pane vertically. |
| Control-a | | Split pane horizontally. |
| Control-a o | Switch focus to next pane. |
| Control-a ; | Switch focus to the previous pane. |
| Control-a ! | Move current pane to a new window. |
| Control-a x | Kill the current pane. |
Miscellaneous:
| Shortcut | Description |
|---|---|
| Control-a ? | Show currently configured keys. |
| Control-a : | Enter the command prompt (for tmux commands) |
You can get more info on tmux and its commands at the relevant Ubuntu manpage entry.